The Group Performance section of DQM shows the combined data for all of the websites in a Group. A Group is a collection of websites and every DQM instance has at least the “All Websites” Group. It is possible for Admins to create and manage groups to contain any number of the websites set up in the DQM instance. Details on how to do this can be found in the “Admin Tools - Group Management” section.
If you have website-level access only, you will not have access to this section. Only Admins, or users with permissions set to “See the Group Performance Dashboard” can access the Group Performance pages. If you need access to these pages, you should speak to an Admin of your account.
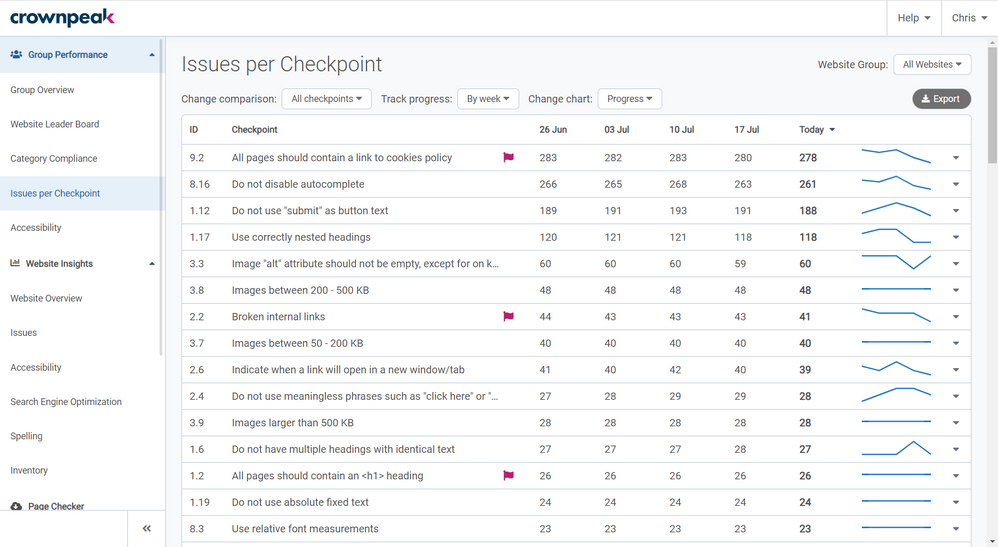
 Issues per Checkpoint page in Crownpeak DQM
Issues per Checkpoint allows you to analyze progress and issue distribution for all of your checkpoints. The numbers shown for each checkpoint are the combined issues at the given date for all of the websites in the group you are viewing. You can change the group you are viewing using the dropdown in the top-right.
The Issues per Checkpoint page contains 3 different chart types, and ways to view the data – Progress over time, Comparison between the data at a chosen date and the data today, and Status of the current distribution of issues today. All three of these chart types and ways to view the data are covered in detail in this guide.
Using the button in the top-right of the page, you can Export data for checkpoint change over time, showing combined group issues counts for each checkpoint either weekly or monthly.
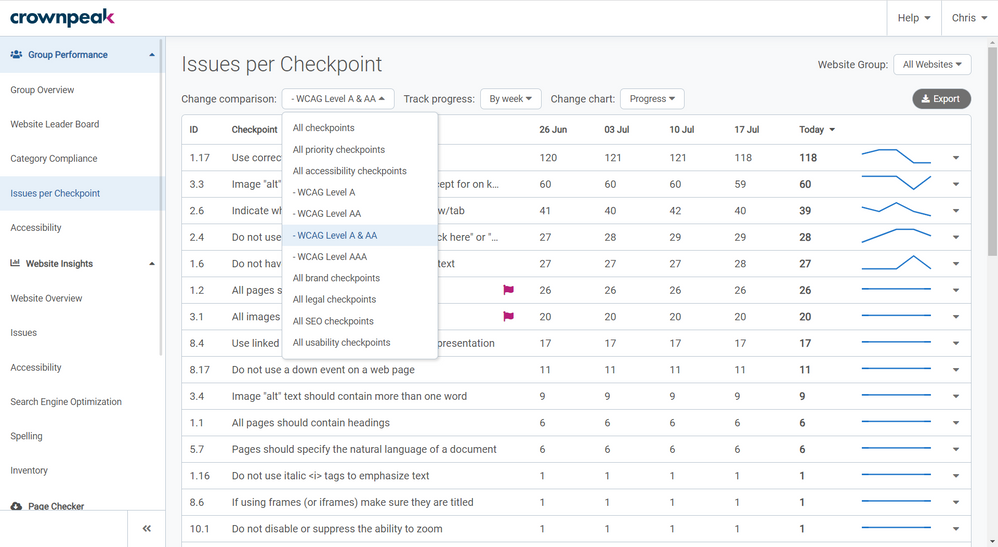
 Change comparison options on the Issues per Checkpoint page in Crownpeak DQM
By default, the page will list all of the checkpoints set up in your DQM instance, ordered by the total number of issues currently reporting across all of the websites in the group you are viewing. The “ID” column shows the ID of the checkpoint in your instance. Alongside the “Checkpoint” name, some checkpoints show a red flag which indicates that the checkpoint is a Priority checkpoint (For more information, see “Priority Checkpoints”). To the right of the checkpoint name is the data for each checkpoint. All of the columns are sortable so you can, for example, sort the checkpoints by their ID or alphabetically by their names.
You can choose to narrow the Change comparison list down by clicking on the dropdown to the top-left of the table. You can choose to view lists of checkpoints based on the topics they cover – including by WCAG level – or you can choose to view just your priority checkpoints.
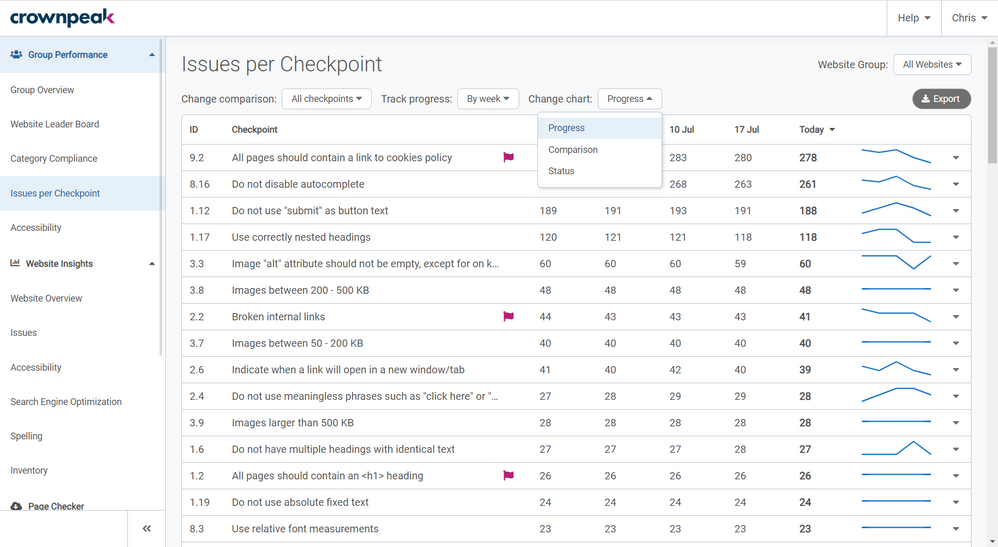
 Chart options on the Issues per Checkpoint page in Crownpeak DQM
Once you have chosen the list of checkpoints you want to see the Change comparison for, you can choose how you want to view the data using the Change chart dropdown menu. By default, this shows “Progress” over time.
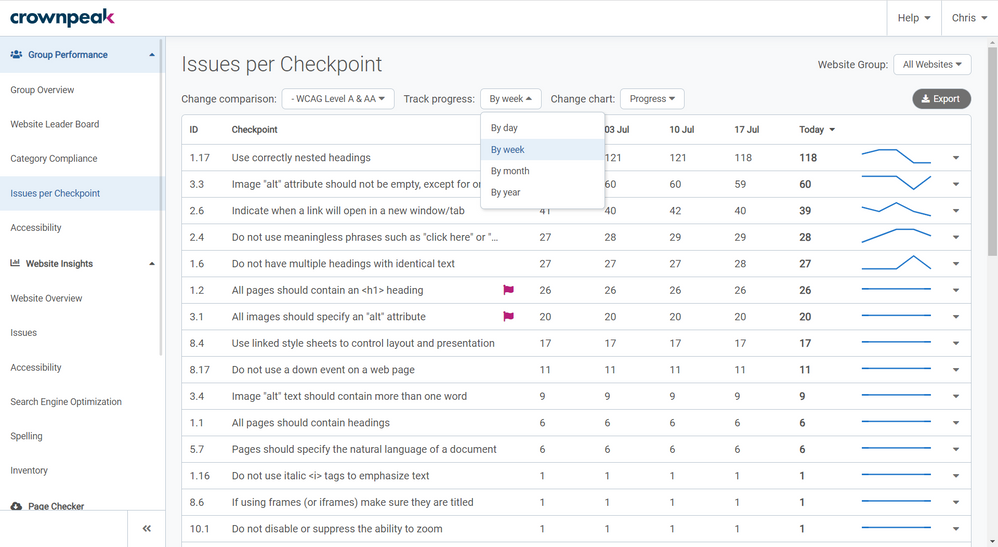
 Track Progress options on the Issues per Checkpoint page in Crownpeak DQM
The numbers shown are the combined group issue totals for each checkpoint at 5 given dates. You can change how far back you want to Track progress using the dropdown and choosing “By day”, “By week”, “By month” or “By year”.
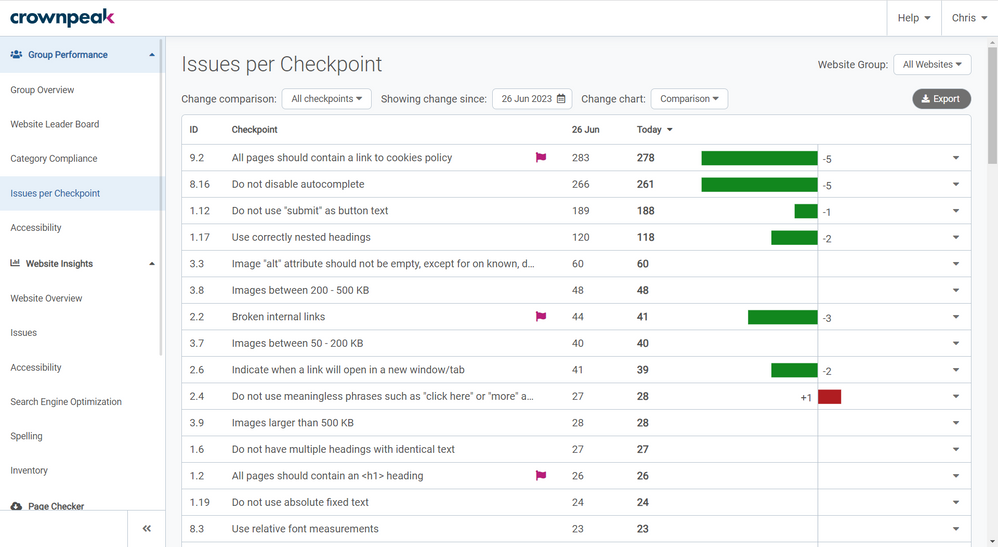
 Comparison chart on the Issues per Checkpoint page in Crownpeak DQM
Selecting “Comparison” from the Change chart dropdown shows whether each checkpoint has improved or deteriorated between a chosen date and today, and by how much. Clicking on the date alongside “Showing change since” will show a calendar allowing you to select the date you want to compare today’s data with. Once you have chosen a date, the total number of issues for each checkpoint is shown in the table – both for the date you have selected, and for today. To the right of this is a chart to visualize an increase or decrease in issues. Green bars to the left of the center line indicate that issues have decreased for the checkpoint. Red bars to the right of the center line indicate that issues have increased for the checkpoint.
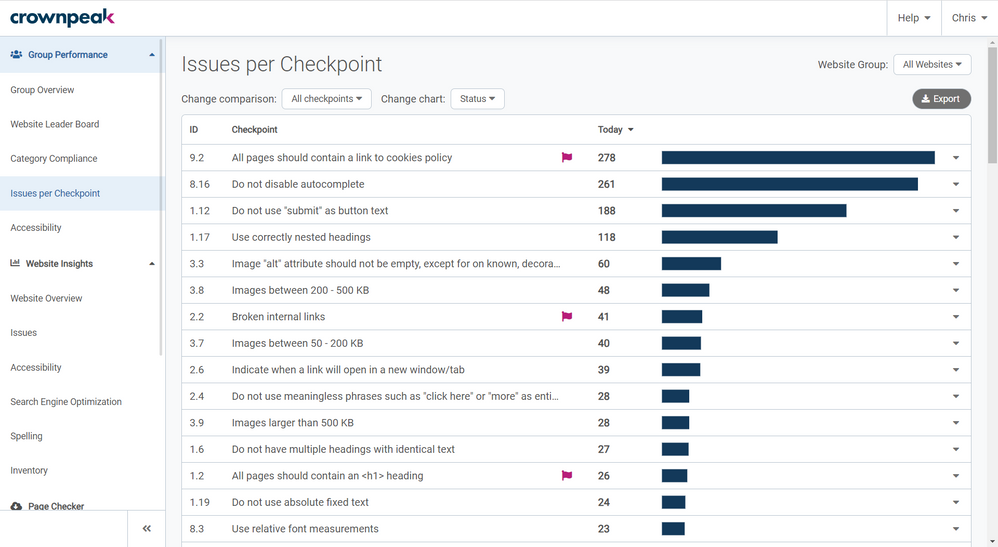
 Status chart on the Issues per Checkpoint page in Crownpeak DQM
Selecting “Status” from the Change chart dropdown shows a bar alongside each checkpoint to help visualize the current distribution of issues today. You can see how many issues you have for checkpoints relative to the number of issues for other checkpoints.
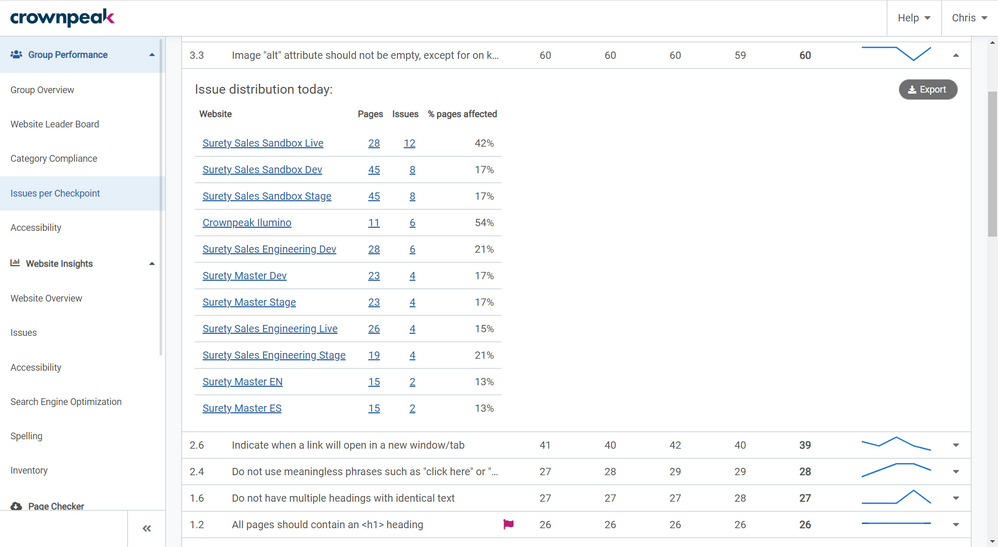
 Expanded Checkpoint on the Issues per Checkpoint page in Crownpeak DQM
In all 3 of the chart types – “Progress”, “Comparison” and “Status” – you can drill down into a specific checkpoint to see where the issues are in each of the websites in the group. Clicking on a checkpoint will expand the checkpoint to reveal the list of websites in the group that report at least 1 issue for the checkpoint. The total number of pages for each website is shown, along with the number of issues reporting for this checkpoint on that website, and the percentage of pages affected by this checkpoint on that website.
 Issue Details overlay on the Issues per Checkpoint page in Crownpeak DQM
Clicking on any of the websites listed, or the data alongside it opens an overlay providing more details, including a short description of the checkpoint, and the list of pages that contain an issue for this checkpoint. This is similar to the “Website Insights: Issues” page.
The date shown under each page listed is the date that we first reported this page as an issue. This date will remain the same with each subsequent scan where the issue remains unresolved.
The percentage of pages on the website that report this issue is shown to the far right of the checkpoint name, along with a button to Export the list of issues for this checkpoint to a CSV.
From the list of pages shown that report an issue for this checkpoint, clicking on one will open the Analyzer as an overlay (See “Website Insights: Issues – Analyzer” for more details). To close the checkpoint overlay or the analyzer overlay, click the “X” in the top-right (just below your name).
